* Poster acceptance into Organization of Human Brain Mapping – Glasgow 2022: Howidi AM, Bock NA. Exploring Demographic Effects on Regional Brain Volumes in a Large-Scale MRI Study. Organization of Human Brain Mapping 2022. Abstract 1604
*Working towards publishing in 2023
Poster:
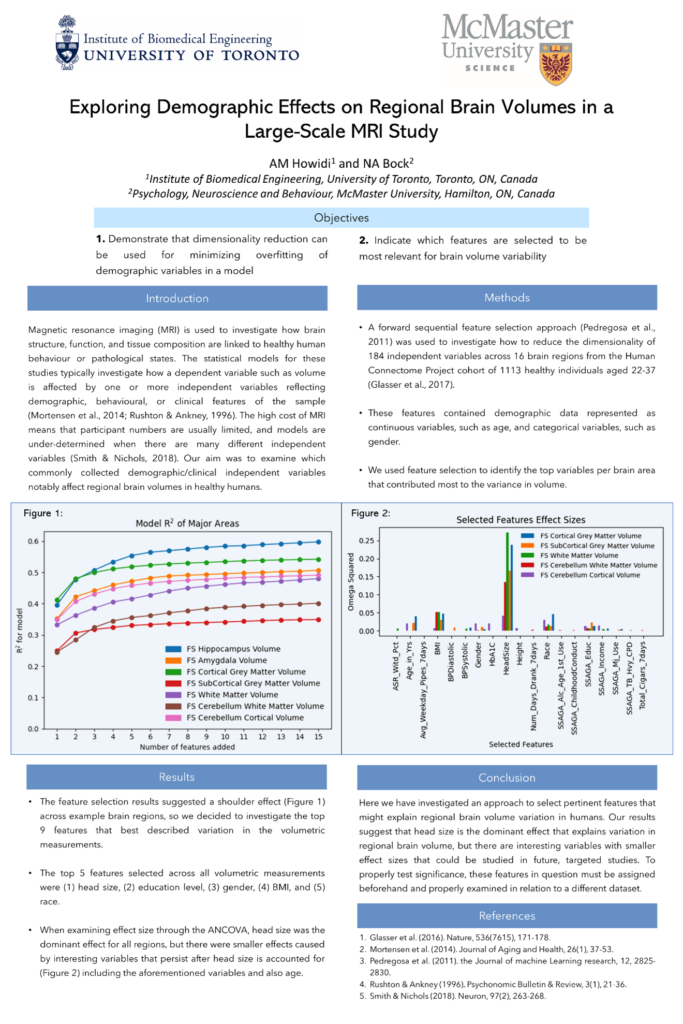
Project 2: Poster presented at Organization for Human Brain Mapping 2022 Glasgow
Abstract:
INTRO: Magnetic resonance imaging (MRI) is used to investigate how brain structure, function, and tissue composition are linked to healthy human behaviour or pathological states. The statistical models for these studies typically investigate how a dependent such as volume is affected by one or more independent variables reflecting demographic, behavioural, or clinical features of the sample (Mortensen et al., 2014; Rushton & Ankey, 1996). The high cost of MRI means that participant numbers are usually limited, and models are under-determined when there are many different independent variables (Smith & Nichols, 2018). Our aim was to examine which commonly collected demographic/clinical independent variables notably affect regional brain volumes in healthy humans.
METHODS: A forward sequential feature selection approach (Pedregosa et al., 2011) was used to investigate how to reduce the dimensionality of 184 independent variables across 16 brain regions from the Human Connectome Project cohort of 1113 healthy individuals aged 22-37 (Glasser et al., 2017). These features contained demographic data represented as continuous variables, such as age, or categorical variables, such as gender. We used feature selection to identify the top variables per brain area that contributed most to the variance in volume. We then used an ANCOVA framework to investigate the effect of each of the variables on volume. All data processing was performed in Python.
RESULTS: The feature selection results suggested a shoulder effect (Figure 1) across example brain regions, so we decided to investigate the top 9 features that best described variation in the volumetric measurements. The top 5 features selected across all volumetric measurements were (1) head size, (2) education level, (3) gender, (4) BMI, and (5) race. When examining effect size through the ANCOVA, head size was always the dominant effect but there were smaller effects caused by interesting variables that persist after head size is accounted for (Figure 2) including the aforementioned variables and also age.
CONCLUSION: This serves as important explorative data for future studies of the potential relation between the volume of brain structures and healthy mental performance or disease symptomology. Our results show that head size dominates effect size, but there are other features that have smaller effect sizes that might be sensible to explore in future studies. Since this study only explored healthy humans, it might be that there are other demographic and clinical features that become important for explaining regional brain volume in disease populations.
References:
Glasser, M. F., Coalson, T. S., Robinson, E. C., Hacker, C. D., Harwell, J., Yacoub, E., … & Van Essen, D. C. (2016). A multi-modal parcellation of human cerebral cortex. Nature, 536(7615), 171-178.
Mortensen, E. L., Flensborg-Madsen, T., Molbo, D., Fagerlund, B., Christensen, U., Lund, R., … & Avlund, K. (2014). The relationship between cognitive ability and demographic factors in late midlife. Journal of Aging and Health, 26(1), 37-53.
Pedregosa, F., Varoquaux, G., Gramfort, A., Michel, V., Thirion, B., Grisel, O., … & Duchesnay, E. (2011). Scikit-learn: Machine learning in Python. the Journal of machine Learning research, 12, 2825-2830.
Rushton, J. P., & Ankney, C. D. (1996). Brain size and cognitive ability: Correlations with age, sex, social class, and race. Psychonomic Bulletin & Review, 3(1), 21-36.
Smith, S. M., & Nichols, T. E. (2018). Statistical challenges in “big data” human neuroimaging. Neuron, 97(2), 263-268.
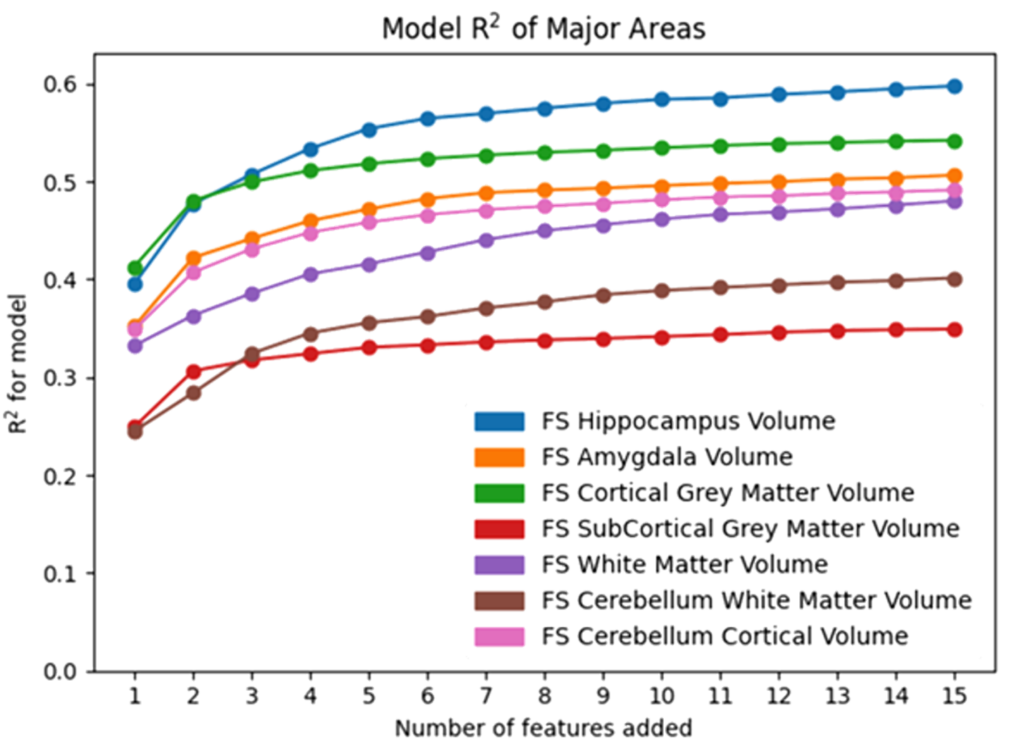
Project 2: Figure 1 from poster: Figure displays how after 9 features are added to a model, the model has a shoulder effect in variance explanation.
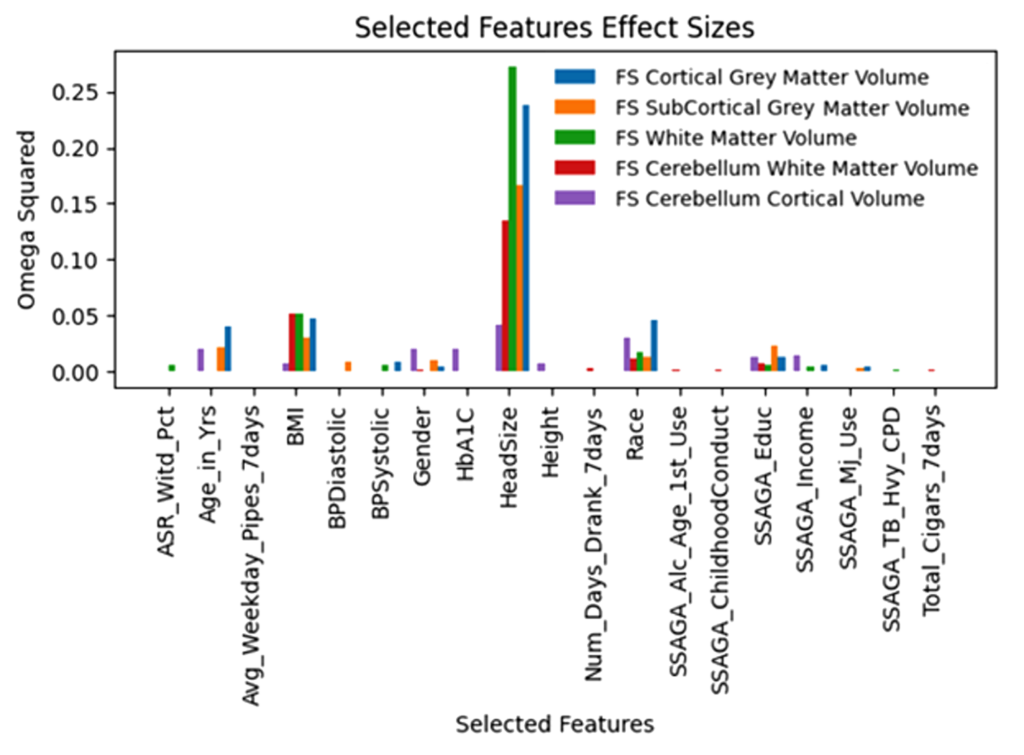
Project 2: Figure 2 from poster: Figure displays that other effect sizes are minimal when compared to Head Size in explaining healthy brain volume. It is important to note that different features were selected for different brain areas, and the effect sizes of different features vary depending on brain area.
Below are some graphs highlighting the process behind the project:
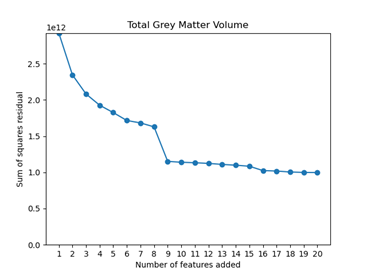
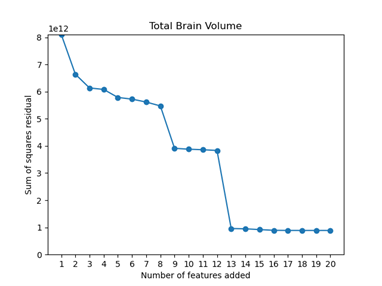
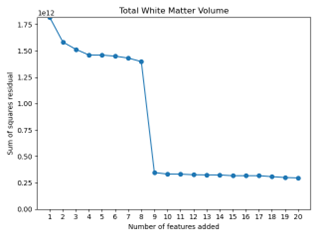
Project 2: Three graphs showing error residuals in varying ANOVA models as more features are added
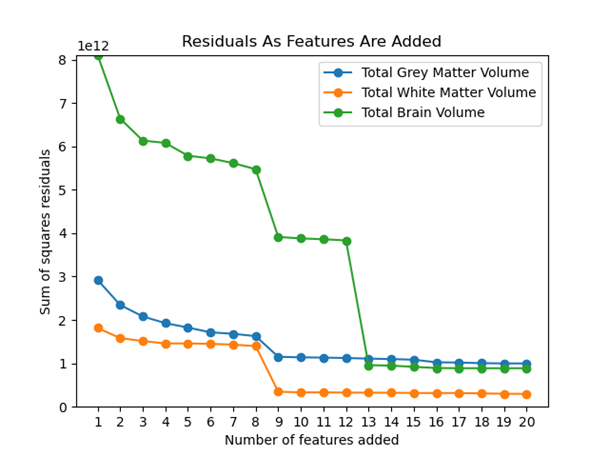
Project 2: Graph displaying how the residuals in different models are affected by increasing the number of features in a model. All the models have a significant increase in variance explained after 9 features are selected for.
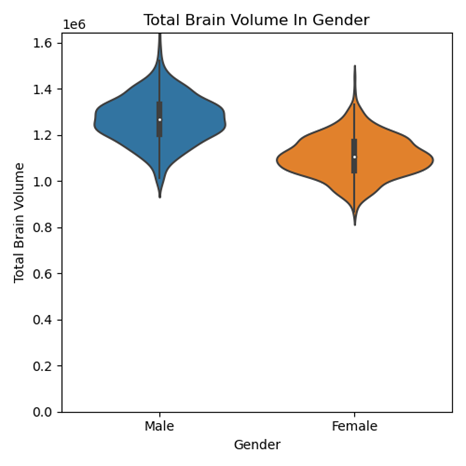
Project 2: Violin plot showing how total brain volume differs in gender. Previous literature reports similar findings. Our study shows that after normalizing for other features, gender has a minimal effect size on healthy brain volume.
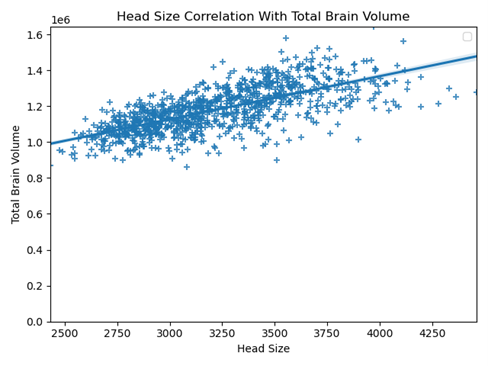
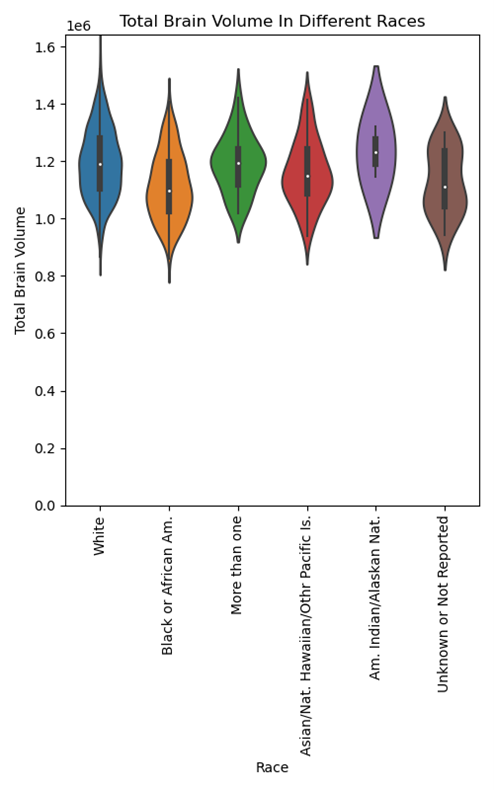
Project 2: A violin plot displaying how total brain volume differs as a function of participant race. Despite the plot not showing significant distribution differences, race was the most selected feature across the dataset and was among the 9 features selected for total brain volume. We believe this is because after accounting for other features, race can explain additional independent variance in brain volume.